Expected Assists (xA) and Received Passes in FM20
Let me introduce you to the little brother of xG, Expected Assists (xG). Whereas xG tells you the likelihood of a goal being scored from a certain position Expected Assists tells you the likelihood of a goal being scored after receiving a pass. The two go hand in hand in real world football metrics, and there’s no reason why you can’t use them in FM20.
We also add another metric to look at. There’s something to be learnt about where players received passes, or the pitch impact they have.
Metrics other than Expected Assists
Before we crack on with Expected Assists it’s probably useful to look at some of the other statistics and metrics in the game (the real world game that is, not FM20). There are a lot of links between them and as part of some of my articles here (and on YouTube) we’ve covered some already.
Expected Goals (xG)
We’ve got the full run down in our earlier xG article. But basically xG is a measure of how likely a shot from a particular position or situation is to result in a goal. Shots in the box tend to be more likely to result in a goal than those outside the box for example, so you want your strikers getting into the right positions.
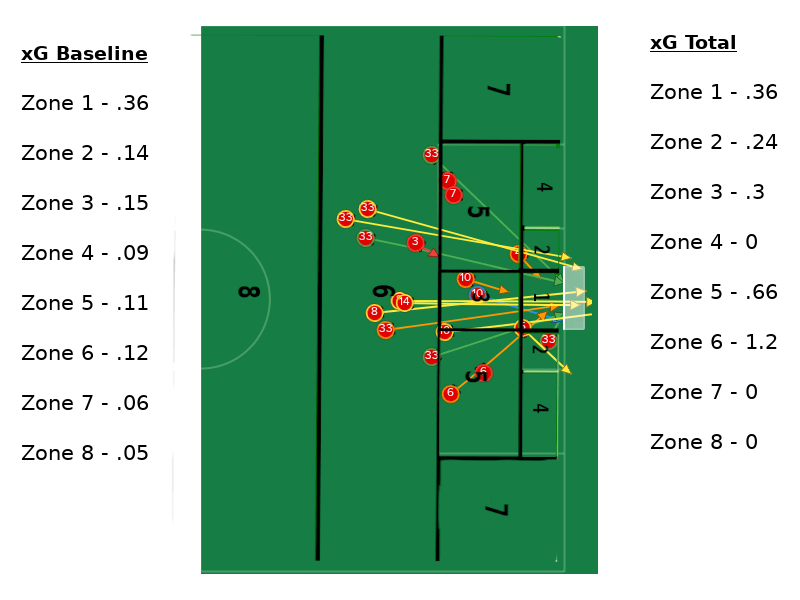
This doesn’t exist as a stat or metric in FM20. It’s something you have to pull out yourself. If you divide the pitch into zones, you can count the shots for each zone. Each zone has a different xG value associated with it, and you multiply it by the number of shots in that zone. Finally you total it all up and work out what your xG for that match was. Just like sites such as Understat do for real world football.
You can use this in FM20 to work out whether you are under or overperforming in terms of goals, if you’re going through a lucky streak, if a change in tactics or personel is improving your output and so on. Alternatively break it down on a player by player level as well to see if a new recruit is doing the job.

xG Against or Goalkeeper Efficiency
If xG lets you know about your attacking output then you can turn the metric on its head to assess your goalkeeper. If you work out how many goals from on target shots you would expect to concede (your xG against) you can then compare this to how many your keeper did concede to see if they are over or under performing.
I did this with my Belfast Celtic keepers and was able to finally work out that one of them was dropping more balls than the other (literally and figuratively). You can also hear the Zonal Marking podcast talk about this.
Expected Assists (xA)
In the real world you can take into account the type of pass made, the position of defenders, and the position the pass is made from/received in to work out the likelihood of that pass leading to a goal. The likelihood of that pass being an assist.
This can be a really useful tool for assessing how creative or productive a team is being. In many ways it is a much clearer measure of chances than the chance, half chance and even the key pass stat you can find in FM20.
How do we work out Expected Assists?
Just like xG expected assists are not in vanilla game. Well it’s not in any version of the game. You have to pull this data out.
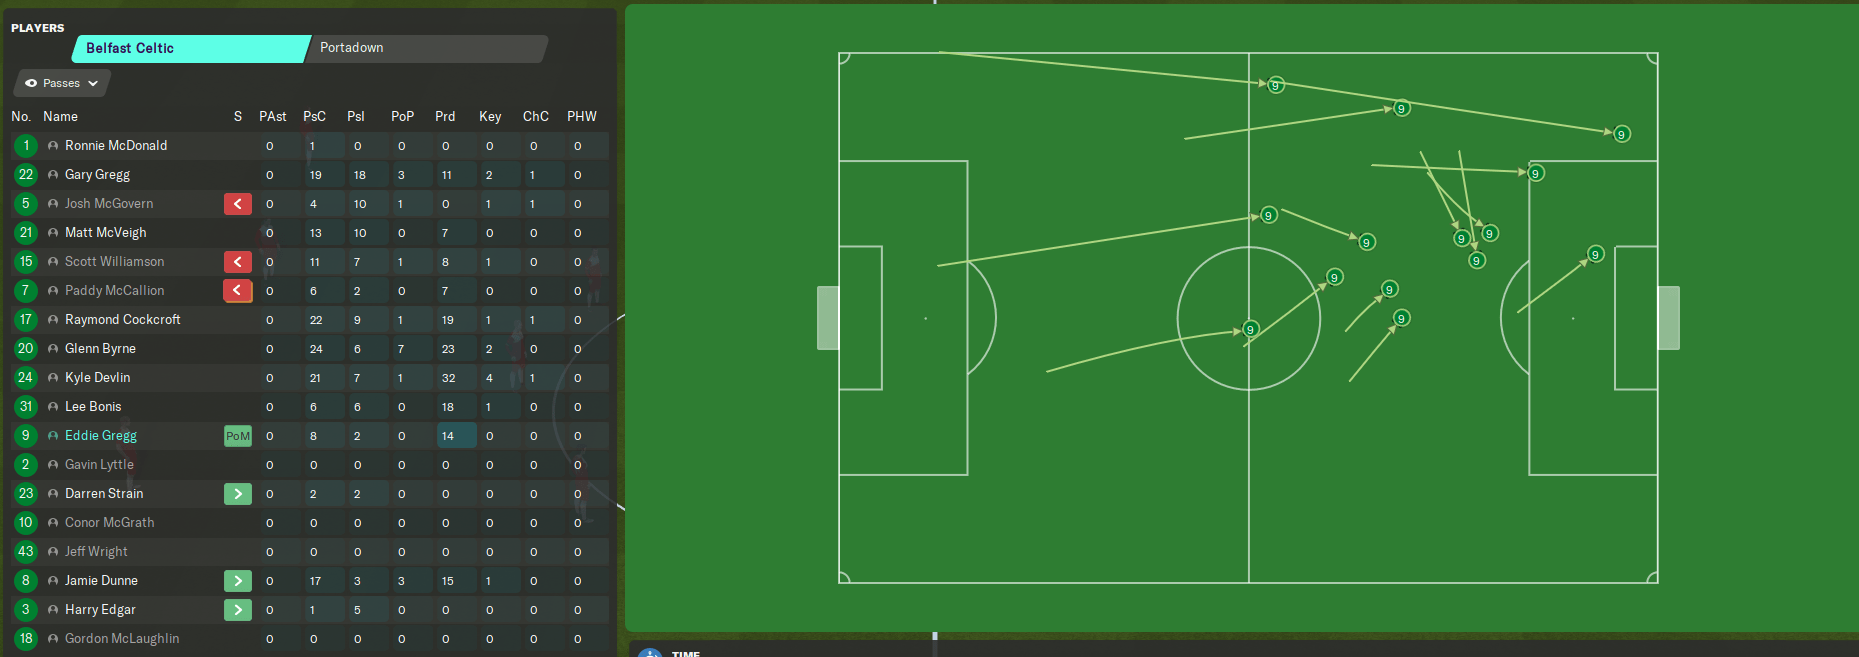
The first thing to do is to head over to the team analysis after a match, and bring up the stats for our team. We want to head over to the passing tab. This gives us a range of stats.
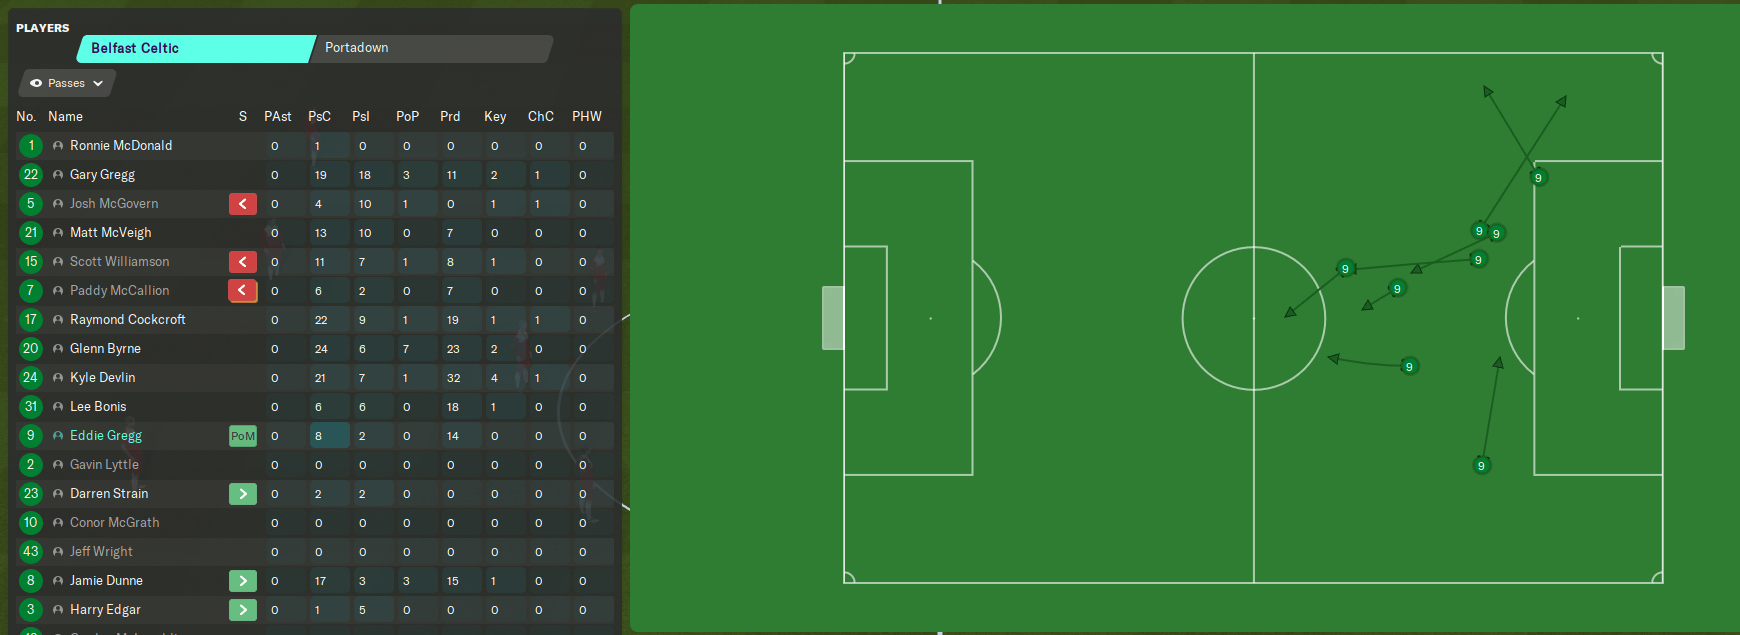
Now we want to make sure we just select activity from our team, and activity in the opposition half. This is because technically every pass, has a chance of being an assist. Your full back could get the ball passed to them by the centre back, run the length of the pitch and score an absolute rocket. That pass deep in your half would be an assist. But, most passes that start in your own half, and end up in your own half do not have a high xA value. Including them involves a lot of counting of passes that will artificially bump up your overall xA slightly.
Once we have that sorted we can select completed passes and see where they occurred. What we are interested in is where the pass ended up.
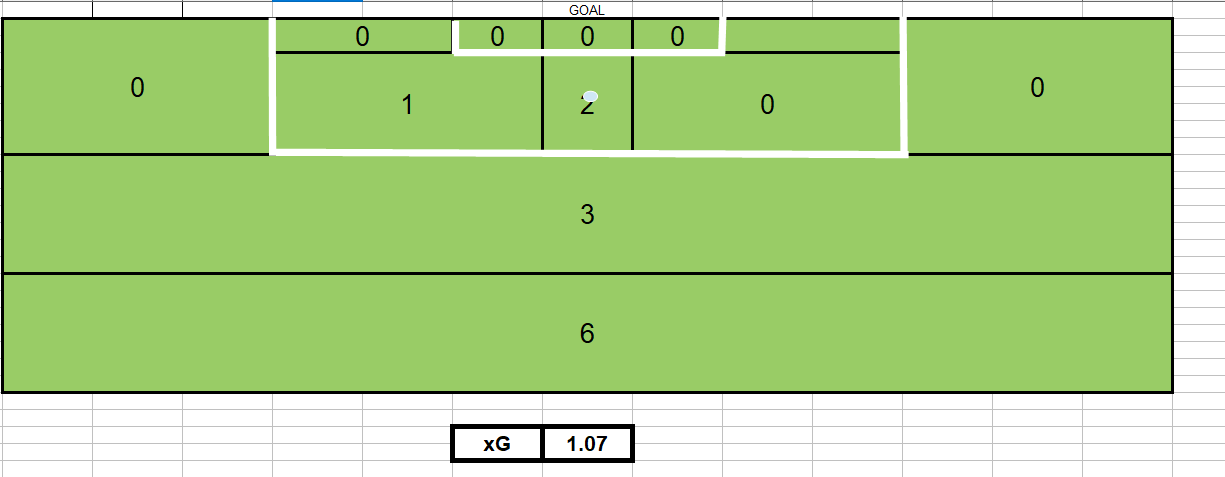
With these pass locations we can then look at our fancy zone spreadsheet we used for xG…and do the exact same thing as before. We use the same values, add up the passes, and get an overall xA.
The more passes made to dangerous high scoring areas the higher the xA. Also the more passes made generally the higher the xA will get.
Something keep in mind though for the stats lovers. This model of xA is basic. It’s just using the data we have for our xG model, and that was also basic. All it takes into account is pitch position. It doesn’t take into account the type of pass, the location of other players, whether it’s on the counter etc. The real world models of xA also find that crosses have quite low xA compared to other types of passes. We don’t have that kind of subtlety in our model. It is basic, but it is better than no xA at all which is what the game gives us.
Expected Assists in my FM20 game
How does this work in an actual game of FM20 then? Well I’ve used xA recently to help work out which striker to cut. And I mean cut from the team completely. In my Belfast Celtic save I have limited resources and I need strikers who can score and who can assist. So I checked out their xA.
Four strikers of interest. Only the money to keep three. Bonis and Devlin had been with me for several seasons but with promotion to the top flight I needed a bit more punch. McLaughlin and Ward were meant to provide that but I found myself going back to Bonis and Devlin out of habit. This had to stop. I needed to be guided by the numbers.
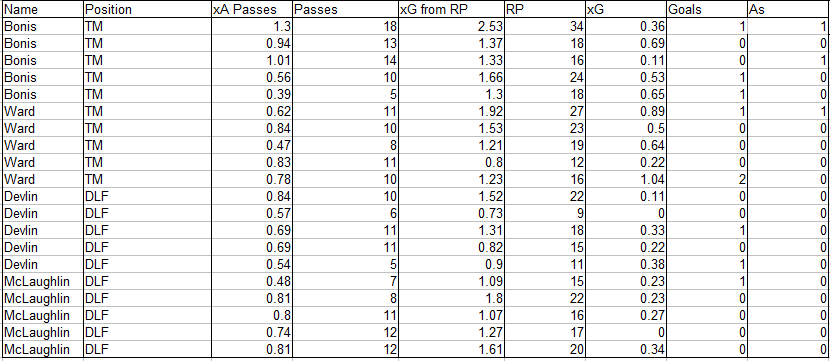
I used a small sample towards the end of the season, and gave them all 10 starts each. From the table above I was able to work out the per 90 values for each key stats from xG to expected assists. And this is what I found:
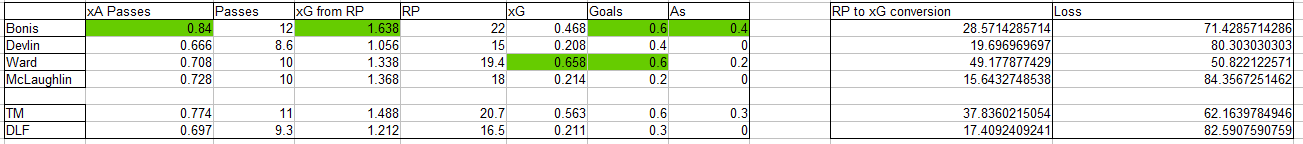
My first thought was that they are all pretty bad. But it became clear that Ward and Bonis were getting me the most goals, but Bonis was also producing the most chances in terms of xA. Devlin in comparison was terrible. Little in the way of attacking or creative threat. They had to go. No hard feelings Devlin but your expected assists were not enough.
What about Received Passes?
This is something else I looked at. You can see it in the tables above. There is a concept or metric called Pitch Impact or in the table Received Passes (RP). This roughly refers to the control exerted by a player on the pitch through the positions they take up. It’s pretty complicated to work out. I decided to come up with a crude version that measures how good the positions a player gets in actually are in terms of goal output.
Again using the same zones as we have for xG and xA we know which areas of the pitch are more dangerous. If a striker is getting into these positions a lot then they are having a big impact. Specifically if they receive the ball in these areas they are having a big impact as they have the chance to score, or the opposition have to do something about it.
A striker who receives the ball in the box a lot has a lot less work to do to score, and gives the opposition a lot more to do to stop them. The consequences for the defense are much more dire compared to a striker who only seems to pick up passes outside the box.
Again it’s not the same as real world Pitch Impact models but it’s another metric we can use.
How to work Received Passes or Pitch Impact out
To find this information we still stay on the passing tab in the analysis. But this time we select an individual players RP or Received Passes. We can now see all the completed passes made to them.
Work out the zones, add them up, and we get a measure of how dangerous the positions they find themselves in are (or would be if they got a shot off).
In the table comparing strikers you can see who is good at getting into dangerous positions (X). But you can also see a drop off. The RP value is almost always higher than the xG. That’s because xG is measured from the actual shots taken. It’s possible to receive the ball in a dangerous position but cause no danger because of a good tackle, poor control, or a poor decisions. Likewise you can improve on the position you are in by dribbling into a more dangerous one before striking.

But this drop off gives us an idea of which players are improving their RP. Or more likely which are less wasteful when in a good position. McLauglin and Devlin in our example have a 80-84% reduction when you compare the RP to the xG. This could be poor control, getting tackled (maybe after dwelling on the ball), or passing to others. But we can tell that Ward is the least wasteful player when considering their conversion of a good position, into a good shot.
Where does that leave us?
Well we have a few more metrics to add to our list. Crude though they might be compared to real world models we can now add expected assists and pitch impact/received passes to xG and xG against.
They take a little effort but they can be really useful when trying to get a little extra out of your players. And assess whether your FM20 tactics are working as intended.
Something to note as well is that I’ve spoken at length about my strikers, judged their performances and made decisions about their future without ever referring to their attributes. These stats are perfect for an attributeless save or a moneyball save/
If you want to try you hand at calculating xG, xA and Received Passes/Pitch Impact you can find my basic spreadsheet at the end of this post on my personal blog.
You can find Dictate the Game online at:
If you liked the article you can find some more below, and our podcast on anchor and other platforms.
- Taking on the World #5
- Inter the Game
- Unsung Heroes: Raumdeuter
- Total Football Journeyman: Bossing the Ball like 1995 Ajax
- Dictate The Podcast – Quarantine Quiz Special