
FM20 | Moneyball | Part 1
Welcome back to Moneyball. It’s been a while.
After starting my Data Analysis Masters this September, I haven’t had as much time as I would have liked to sink my teeth into FM20 and get started with my Moneyball series. With a gap in the calendar, and a free January, I’ve decided now is a good time to get writing.
What is Moneyball?
If you haven’t read the series from last year, you can check it out here. Essentially, the idea is the same. Using statistics to exploit market trends, aim to achieve the best value from the lowest possible investment. However, I am operating out of Budapest, Hungary. I’ll be incorporating some Soccernomics (A brilliant book by Simon Kuper & Stefan Szymanski), and implementing some more interesting statistical modelling.
I’m also playing without attributes, meaning all my scouting and team selection will be based on stats. This experiment will see whether using data in FM can have an effect on signings, your squad, and ultimately, your results.

I discussed this in more depth in a recent post I published, which you can check out over on my site. In case you haven’t read it, here are the rules I’m implementing for signings, alongside the Moneyball approach of stats based signings.
- Some nationalities are overrated (pg. 24) – I won’t be buying players from England, Spain, Brazil, Holland etc.
- Be as eager to sell good players as to buy them (pg. 29) – If an offer comes in for a player which is over what I deem their “market value”, I will accept.
- Older players are overrated (pg. 29) – No players signed over the age of 27.
- Buy players in their early 20’s (pg. 45) – Try to sign players who are 20-25, no players under 19.
- Centre-Forwards are overpriced (pg. 47) – Avoid expensive, high scoring centre-forwards. Look to create some from within.
- Say no to transfers (pg. 49) – Limit of three transfers per season.
After ten games with Budapest Honved, there is now enough data to begin to analyse the team. I’ll break it up into three sections. Firstly, we’ll take a look at the results over the past ten games.
Results
The first ten games have been a tough old slog, grinding my way through the Europa League to the third qualifying round and playing some difficult opposition in the league. After being knocked out of Europe by Braga, (a tough ask) my main focus is now on the league.
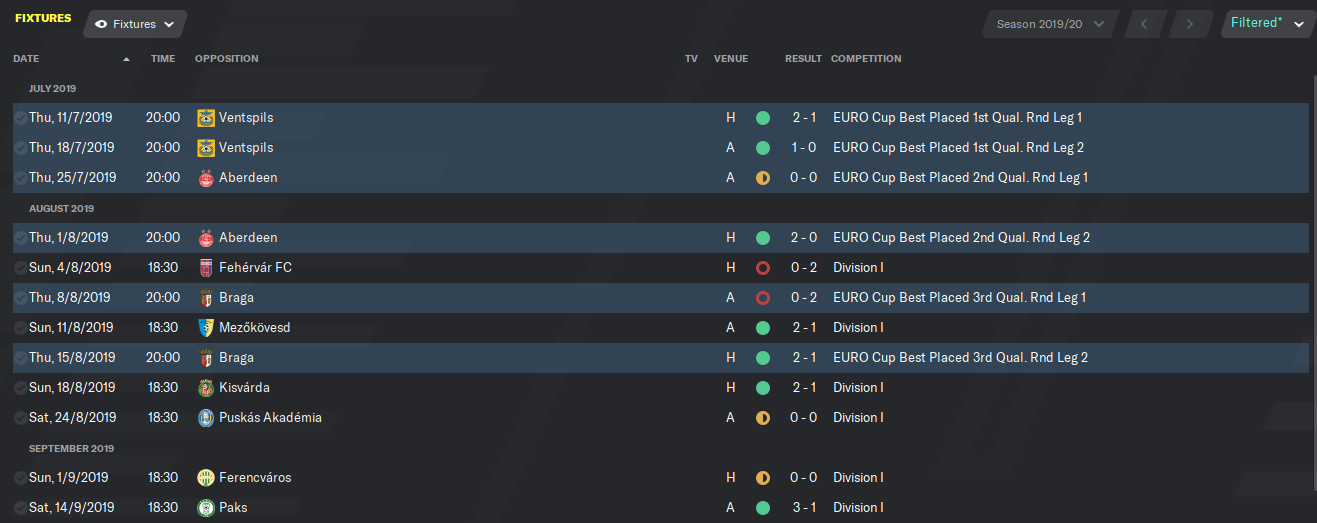
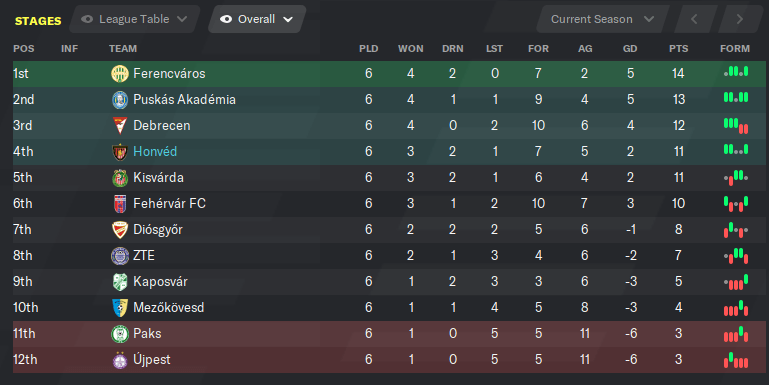
Not an incredible start, but I’m hoping we can hit our stride soon and push higher up towards the top of the table. The team are getting used to the high tempo, high pressing Total Football I am trying to implement.
Player Stats
In typical Moneyball fashion, I’ve set up a spreadsheet to analyse my player’s stats. As we haven’t got enough data to look at signings yet, we’ll first look inwards to spot places we need to strengthen. Using conditional formatting, it makes it easy to see where players are performing well against Key Performance Indicators (KPIs).
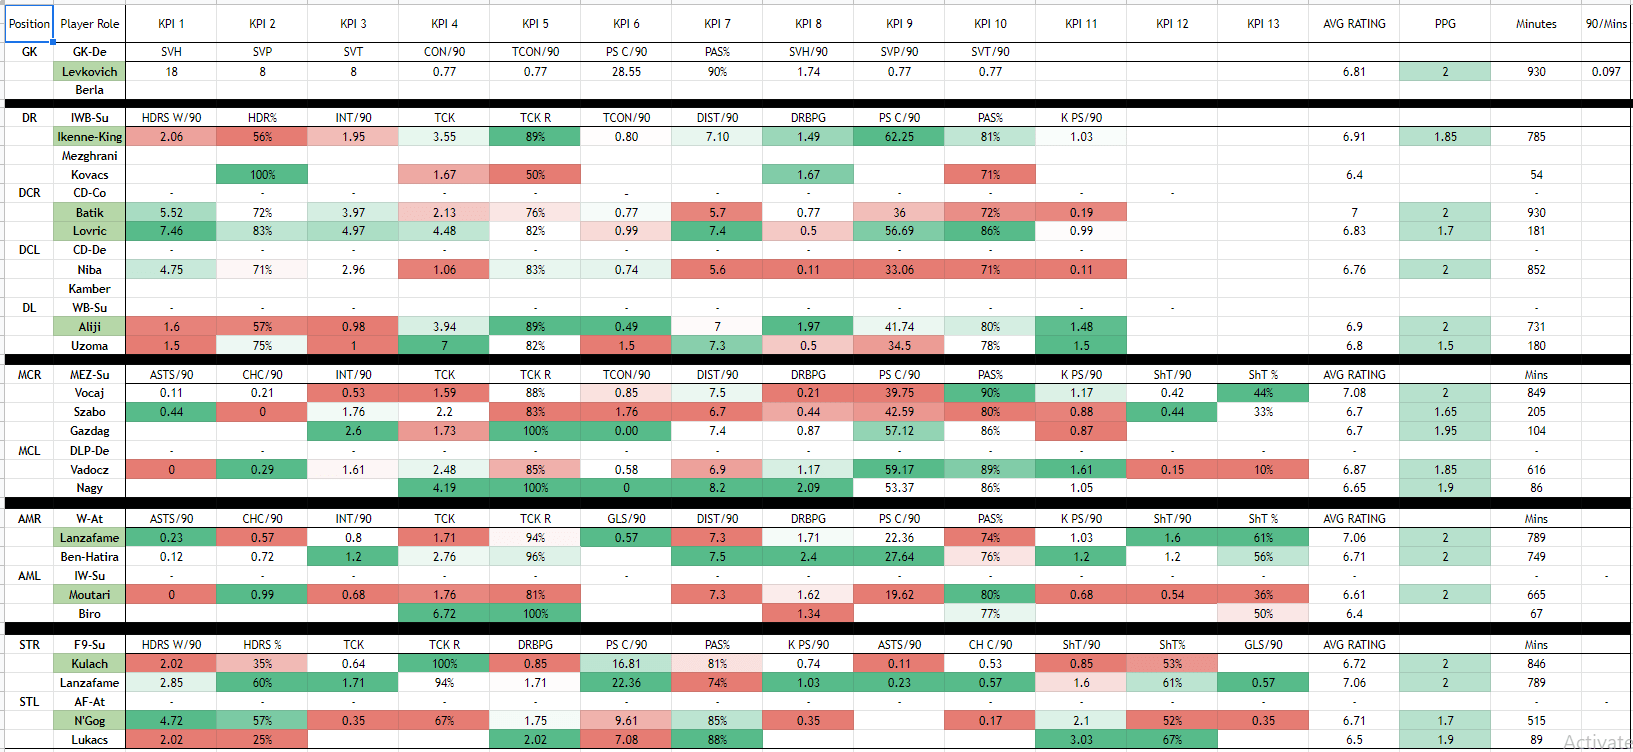
The spreadsheet is a good way of picking the starting eleven. Additionally, it is easy to see which player is best suited to each position. Above, looking at Lanzafame’s stats, it seems he’s more suited to playing as a False 9, due to his excellent passing stats. However, he is one of the top scorers. His versatility across the front line will be monitored.
After the opening 10 games, it appears 35-year-old Ivan Lovric may be a better option at CB than Niba, despite his advancing years. Lovric has won more headers, made more interceptions, and won more tackles. An area of improvement looks to be the left midfield role. Using an Inverted Winger, I’d expect to see more of a contribution. This could be an area for improvement in January.
Team Stats
Next, we’ll look at the stats for the team overall. To do this, I’ve decided to look at xG, using Pelham’s excellent piece which he did for the site last year.
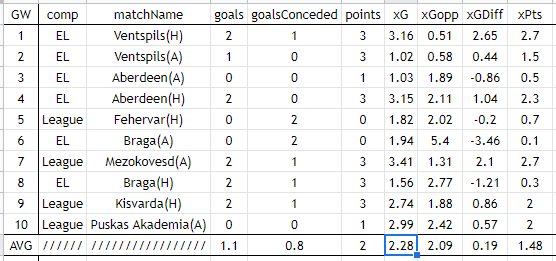
The average xG for the first ten games was 2.28 however we only scored an average of 1.1 goals. It appears that against stronger opposition, such as the games away at Aberdeen and at Braga, we conceded much less than the xG would predict.
At this stage there is little to gleam from xG data. Some of the xG numbers seem slightly high, so calculations may change based on this. What we can see if that for all games other than Aberdeen (A), Fehervar (H) and the two legs against Braga, we’ve had a positive xG difference. We’ve also overachieved on points so far, gaining 2 per game where xPts predicts 1.48 per game.
Looking ahead, I’ll be comparing more of the player and team data available to me, conducting a regression analysis to find which stats have an influence on my results as a team. Once I’ve found these key stats, I’ll be signing players with high numbers, hopefully having an influence on my overall results.
Thanks for reading and I hope you enjoyed this brief post. Hopefully I will have more time over the next couple of months to get into the January transfer window. If you haven’t read my Moneyball series from last year, that can tide you over for the next few weeks. Or you can keep an eye on other excellent content coming out on the site. See you next time!
Other articles you may enjoy
- David Moyes as West Ham Manager | FM20 Experiment
- Red Star Alliance – Big Sams Fantastic Four
- Testing your Goalkeeper using xG
13 thoughts on “FM20 | Moneyball | Part 1”
Literally just finished your previous Moneyball series which was great (After watching the film on the plane) and you’ve already started a new one! It’s made me start a moneyball file myself. Great read and use of the spreadsheets. Looking forward to more instalments!
Thank you!
As always great read! What kpi would you look for 352 formation? Looking forward to start a Moneyball save but stucked with spreadsheet creation
Thanks! It depends on your tactic but I played a 3-5-2 last year so you could look at those KPIs for inspiration. My spreadsheet is available to download if you need some helps starting off
https://ufile.io/6rwdj7m3
oh thank you so much!!!
Hi FMVars,
thank you for your great job.
I have a question about the spreadsheet: how do you enter
statistics taken from FM into the spreadsheet?
Do you create a view with the KPI of the spreadsheet in FM too?
Thank you for your help
What does “PPG” means in the KPI spreadsheet ?