
How to tell if your Goalkeeper is any good using xG against in FM20
The Goalkeeper. We need them, but I am terrible at working out whether mine are actually any good. With us being deep into our FM20 saves, whether we are in the Premier League with high fliers like Liverpool or in the lower leagues fighting against relegation, were are all probably looking at how to improve out teams. This could be through the transfer market, via training, or even tactically. However we plan on making changes we have to work out where our strength and weaknesses are. This means assessing our players. In this post I am going to cover how I try to assess my own goalkeepers.
The Goalkeeper Problem
FM20 now gives you more statistics about keepers than ever before to help you judge how well your goalkeeper is actually doing. Well penalties faced and saved being goalkeeper player statistics you can use now as well as tipped, parried and held saves.
But are these statistics actually any use? Judging goalkeepers can be a very difficult task. Goalkeepers are arguably more reliant on the players in front of them than most other positions are. If the defence is poor and leaky they will face more shots. If the midfield aren’t keeping hold of the ball the team will be under more pressure. And if the strikers aren’t scoring then any goalkeeping errors are the other end will be fatal for the team.
A keeper with a higher than average amount of conceded goals might not be a bad keeper, they might just be a keeper under pressure.

We can also flip this around – a goalkeeper with a fantastic team in front of them might not end up under the microscope as much as others, and get an easy ride as a result. Until they get found out against a much better team or in a high pressure situation.
What is xG?
I am plagiarising from myself pretty much verbatim but xG or expected goals is basically a measure of chance quality. This is a very brief and clumsy explanation but every chance in a match can be given a value representing how likely a shot from that position or situation is to result in a goal. This is normally a value between 0 and 1, with 0 obviously being no chance and 1 being a 100% chance, or 0 being no goal expected and 1 being a certain goal. A shot from a position with a .1 value would suggest a 10% chance of goal from that position.
Websites like understat use this to help clarify how teams have actually performed compared to the final score line. As a stat it is increasingly used by analysts and teams to assess the attacking or offensive performance and quality of team. Either over a series of games, by club or even by player. If you want to have a go at looking at it within FM20 you can use my guide here.
As I’ve said though, xG tends to be a very offensive focused statistics, and keepers are anything but. This is where we need to invert xG and look at xG against instead.
What is xG against?
We can use xG to assess our keeper. If we look at the xG of our opposition we can work out how many goals we would, on average, expect them to score. We can break this down a little further and look only at how many on target shots there were and what the xG was for them – after all our keeper can only really be expected to deal with on target shots.
With the xG score faced by our keeper we can then record how many goals were actually scored and get an efficiency score (stolen shamelessly from Football Hackers by Christoph Bierman). It is as simple as taking the goals scored away from the on target xG score. If the total is a negative then more goals were conceded than you would expected, a positive indicates fewer goals were conceded than expected.
A keeper who is getting negative efficiency scores is a keeper who is letting more in than the quality of chances they have faced suggests they should. They are poor, or they are making mistakes.
However a good keeper will be getting positive scores as they will be saving more than expected, out performing the stats and conceding fewer than the average or poor keeper.
For example lets say Goalkeeper A has conceded 20 goals, but has an xG against of 35.4. When we work this out we get a value of 15.4. This means they have kept out a whopping 15 extra goals. They are playing amazingly well.
Alternatively Goalkeeper B has conceeded 20 goals also, but has an xG against of 15. Our calculation now gives us -5. In this case goalkeeper B has conceded 5 more goals than you would expect.
Goalkeepers A and B have both conceded 20 but keeper A has been performing well above expectations, whereas keeper B has probably cost their team points by allowing in some goals they really shouldn’t have.
With this we don’t need to worry about how good the team is in front of them. Whether they are playing for relegation candidates or title hopefuls. It just gives us a simple metric.
My Goalkeeper
Lets put this in to practice. Below you can see Gibbo, or Gibbons. He’s been with me at Belfast Celtic for almost two seasons as part of my By the Number save.

When we look at his stats for the past seasons he has played 43 league matches and conceded 49 goals. Initially that doesn’t sound too bad. To put it in context Belfast Celtic were promoted from inactive non-leagues. We were expecting to be relegated.

But what I need to know before dipping into the transfer market with my limited funds and wages is do I need to get a better keeper or a better defense? Would be concede less (and get more points) if I had a better keeper or a better defense? Or is Gibbo excellent between the sticks and I need to tie him down and keep him.
The Process
I used the same grid and odds we set up in the xG article here on Dictate The Game. It’s nice and simple. You use the baseline for each sector to work out the value for each shot and then total it. The only major changes for us here are the fact we are looking at the shots we faced, and only the shots that are on target (as Gibbons doesn’t have to deal with the shots that are shanked wide).
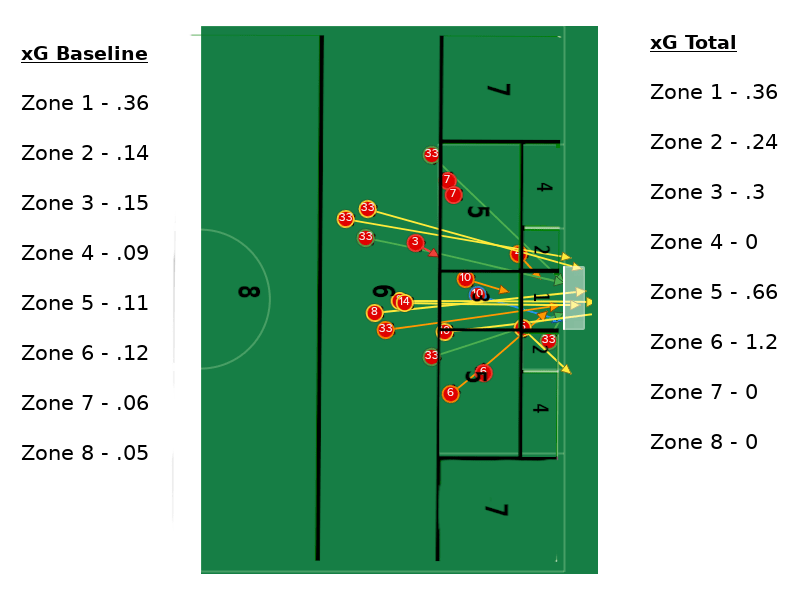
You could do this for every game or you could just look at a run of games. Initially I looked at 10 league games but then gradually expanded it by going back to my old save files so I could see what happened in season one.
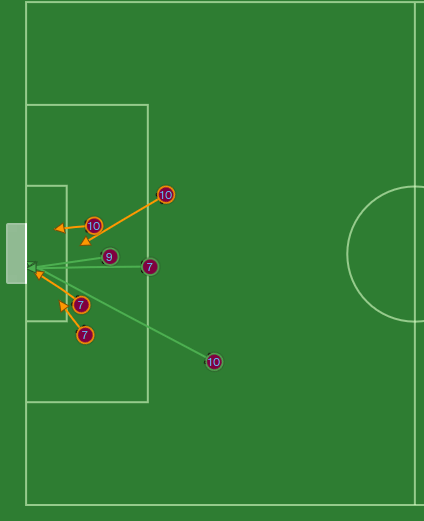
In the example above you can see that although we didn’t have many shots on target against, and the xG overall was fairly low with .94, we conceded 3 goals.
The Goalkeeper Verdict
Gibbons has played 21 league games for us this season and conceded 25 goals.
Across all those games though we have an xG against of 18.2.
With the formula of xG – Conceded we can see that we have an efficiency score of almost -7. That is pretty terrible. That is an extra 7 goals we conceded that the statistics say we shouldn’t have done. It’s time to axe Gibbons and search the transfer market for another goalkeeper.
Goalkeeper Comparison
Goalkeeper assessment is an ongoing process. We’ve ditched Gibbo and replaced him with Robinson.

I’ll be honest, a quick glance at the attributes didn’t really help me here. Neither did looking at his playing history. His record isn’t that different from Gibbons.

In the lower leagues when the difference in attributes might only be one or two points with few stand out attributes clear comparisons can be very difficult. But from looking at the match stats for the last few games played I had a (statistical) inkling that he might be a better option.
He’s played a few games for us this season and so far so good. His xG for league games is actually 13.2. In reality he has only conceded 8 goals (one of the above is a penalty and is not included). That’s an efficiency of about 5 goals. 5 extra goals denied, and when you look at the amount of One-Nils we had it’s clear that is winning us some (undeserved) points. When you take into account the extra 7 goals that Gibbons was letting in we are looking at a swing of almost 12 fewer goals this season.
It is early days but he already looks like a safe pair of hands. Whisper it quietly but promotion might be on the cards now we have assessed our Goalkeeper using xG against.
Make sure you follow us on our social media platforms and let us know if this article has helped you:
If you enjoyed this article consider trying one of the posts below: