
Improving your FM22 tactic using the Data Hub
So if you’ve already got your hands on FM22 you will have noticed that one of the prominent features of this release is the shiny new Data Hub – a panel that allows you to digest a wealth of statistical information about your team’s performance with a broad range of segmentation and visualization options.
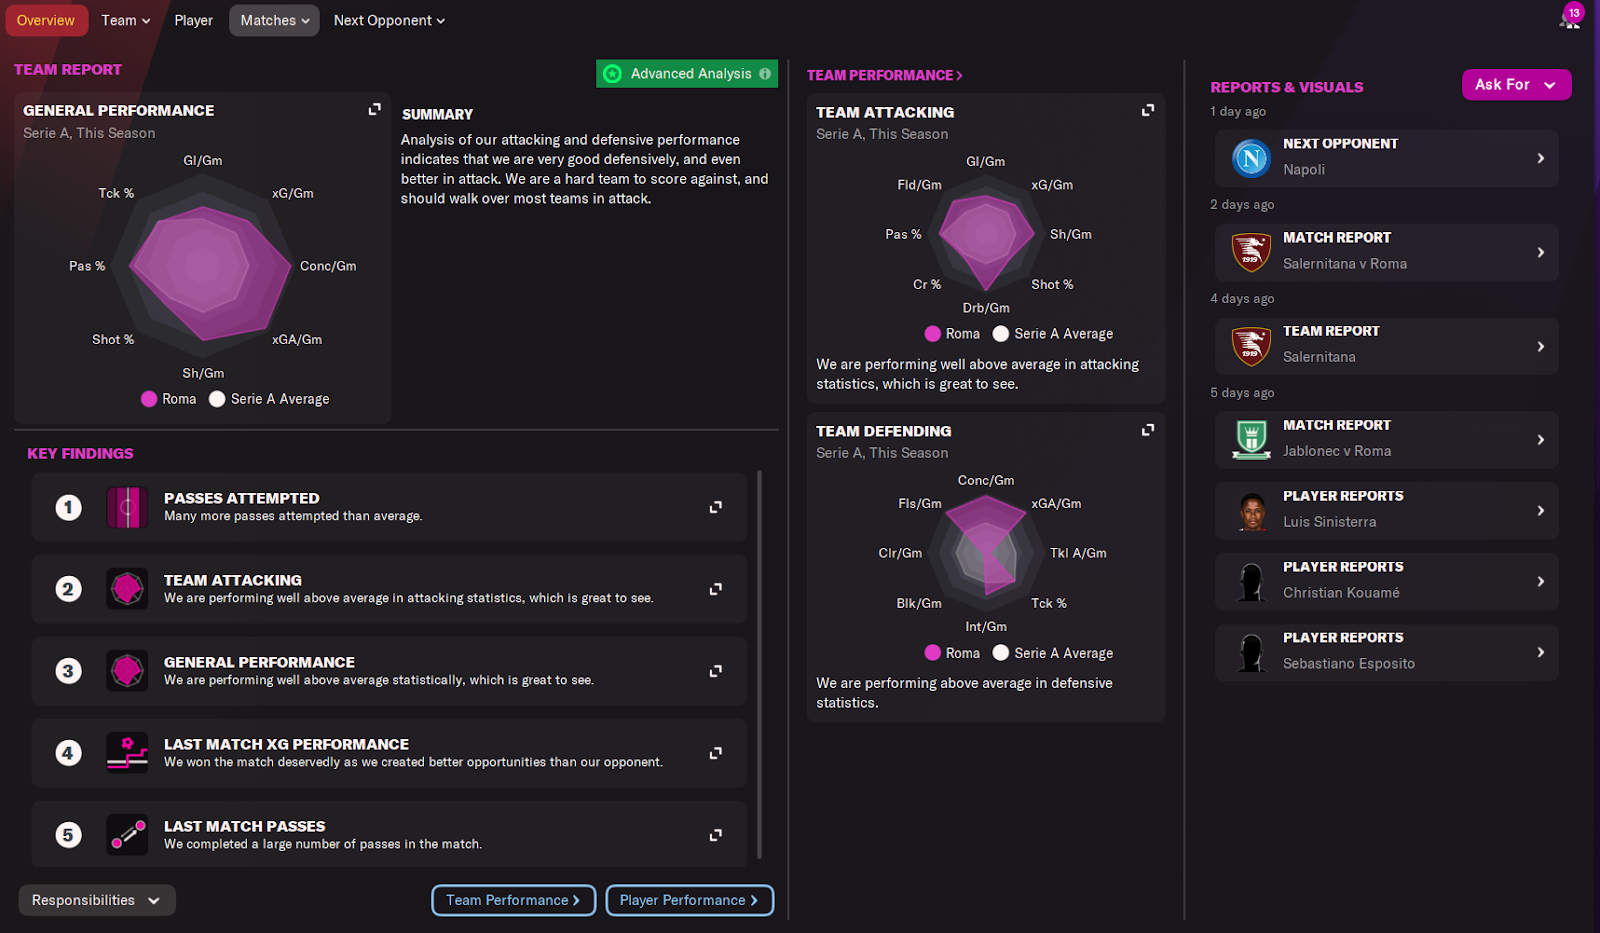
Apart from proving to be a delightful step forward in aligning us as FM players with the modern realities of an ever data-driven footballing world this tool can give you a huge advantage when it comes to squeezing the absolute most of your squad’s abilities and perfecting your tactics.
Diagnose your tactics
A big part of improving the efficiency of your tactics is understanding how and why things went wrong in the first place. Let’s have a look at an example of how the FM22 Data Hub can help you make the correct adjustments using data gathered by your performance analysts.
a key thing to remember is that the quality and range of the data available in the hub is directly linked to the number of performance analysts you employ and the quality of their attributes
In my 4-3-3 attacking system I place a huge emphasis on winning the ball high up the pitch and counter-attacking by moving the ball forward as fast as possible in order to catch the opposition off-guard. For that to happen I need a few separate phases of play to work well in sequence:
1. Midfielders winning the ball high up the pitch via tackles/interceptions
A trip to the data hub>player>midfielders and asking for tackling-midfielders data gives me this panel:
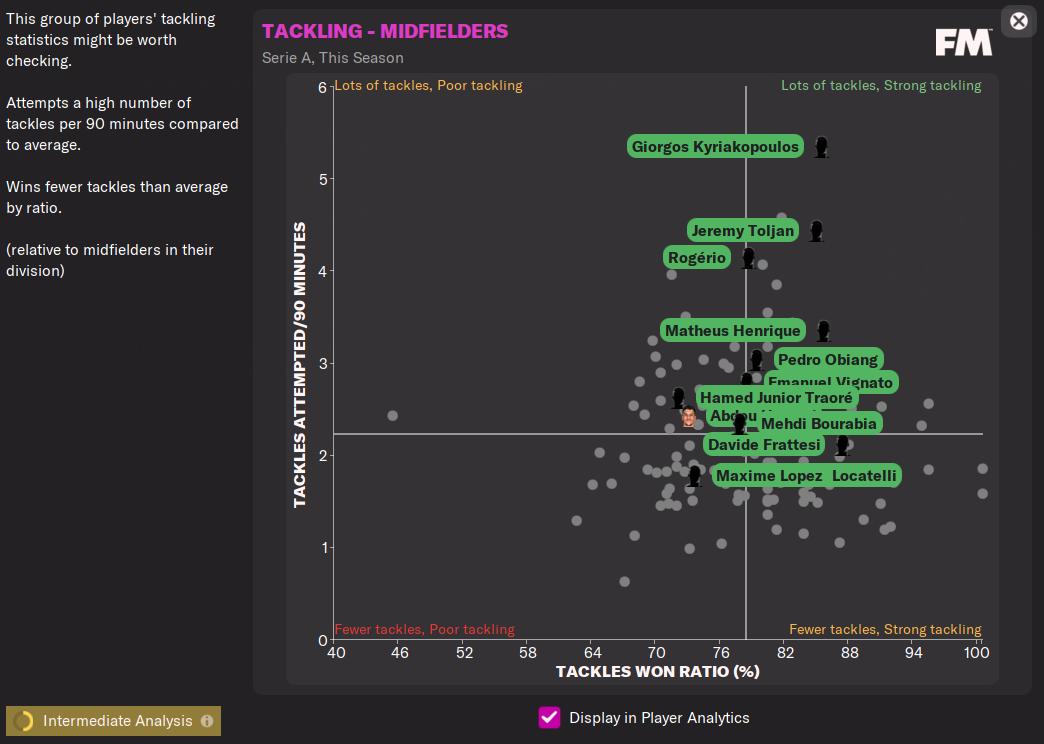
I can see here that most of my central midfielders are efficient in tackling and are attempting a considerably larger number of tackles than the league average. You can also use this screen to provide you a better understanding of a potential team selection – for example Pedro Obiang might be a better choice than Davide Frattesi in the midfield spot if you are playing an opponent against which you want to concede the least amount of possession possible.
A trip to team performance>possession gained however gives me the following info:
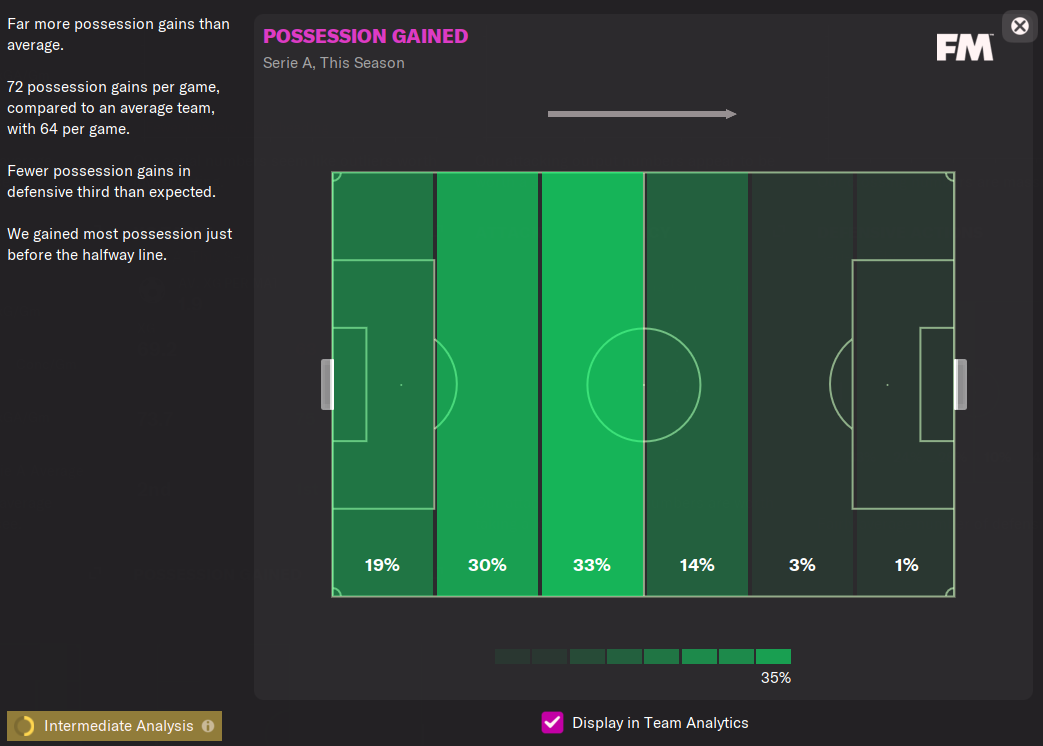
Even though my midfielders are attempting & winning lots of tackles the area of the pitch where we win possession the most is just below our half-way line. Now that is definitely a problem because we aim to win the ball higher up the pitch.
If we look at defensive actions holistically (interceptions + tackles), the same conclusions apply:
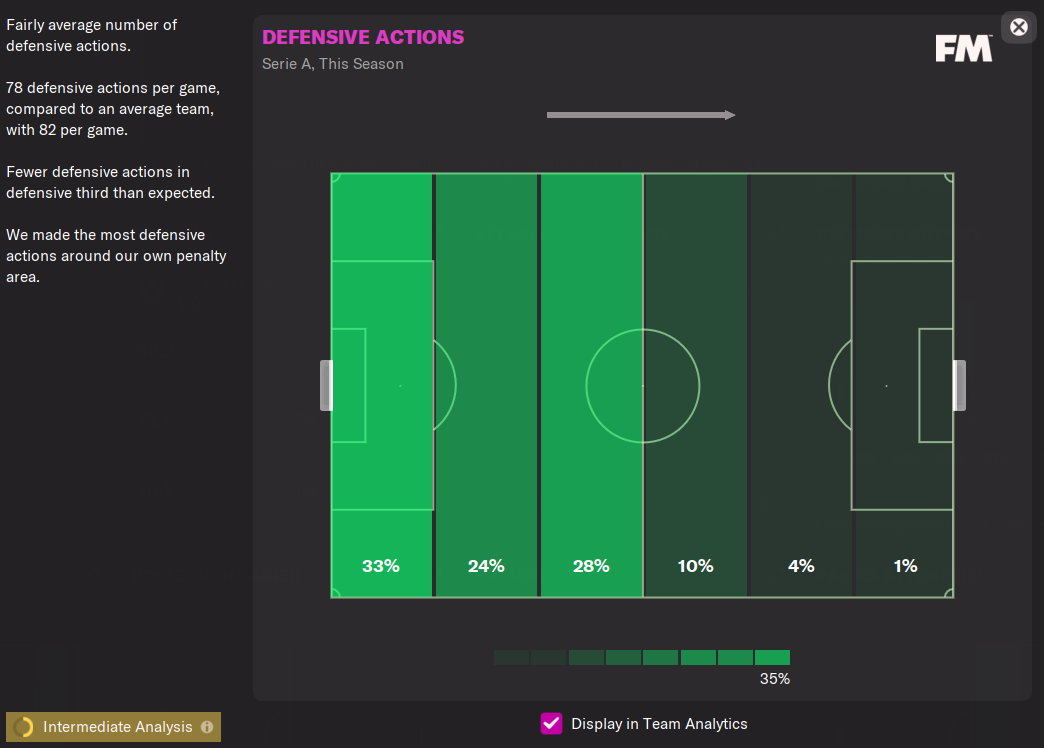
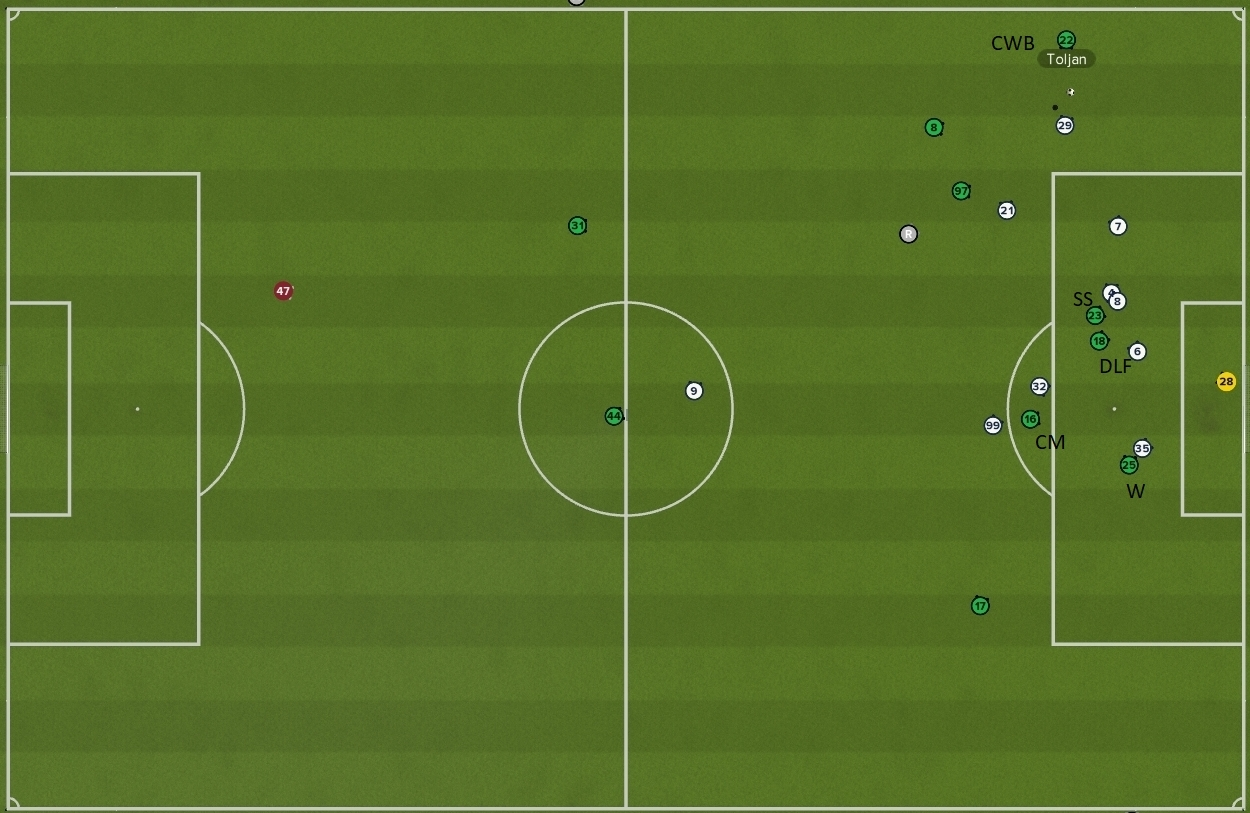
Okay, now to help us contextualize this information, here is the system used:
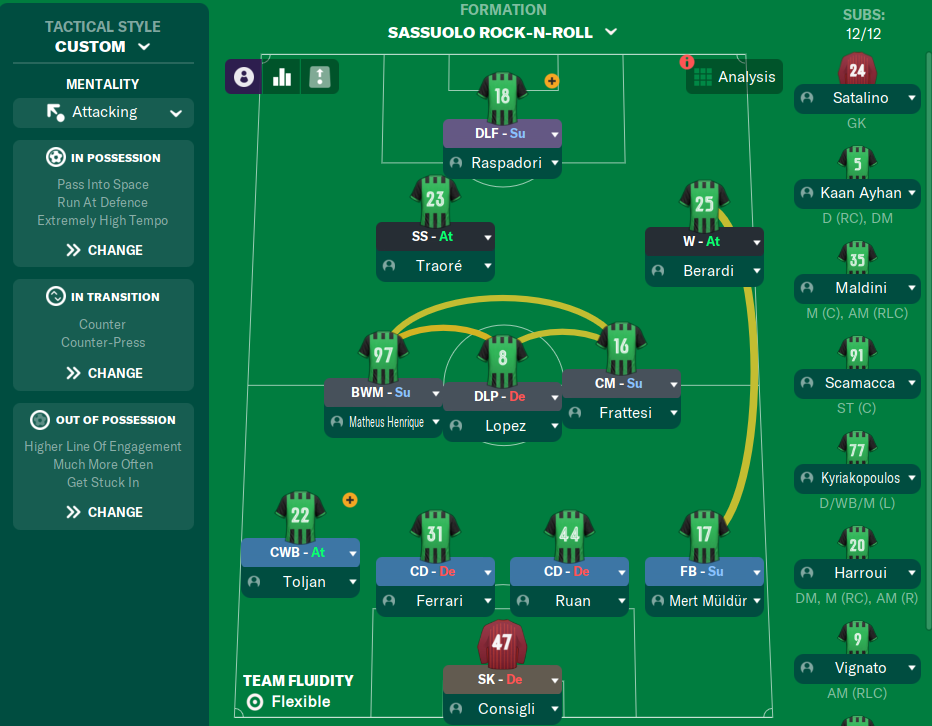
So from what the data above tells us plus the fact that our line of engagement is set to the highest possible level, the conclusion would be that the the front three – the SS, W and DLF are completely inefficient in winning the ball up the pitch, thus we rely exclusively on the midfield 3 to win the ball in the counter-attacking phase of the opponent. This results in winning tackles only after the opponent has passed the midfield line.
This conclusion is also supported by this data panel:
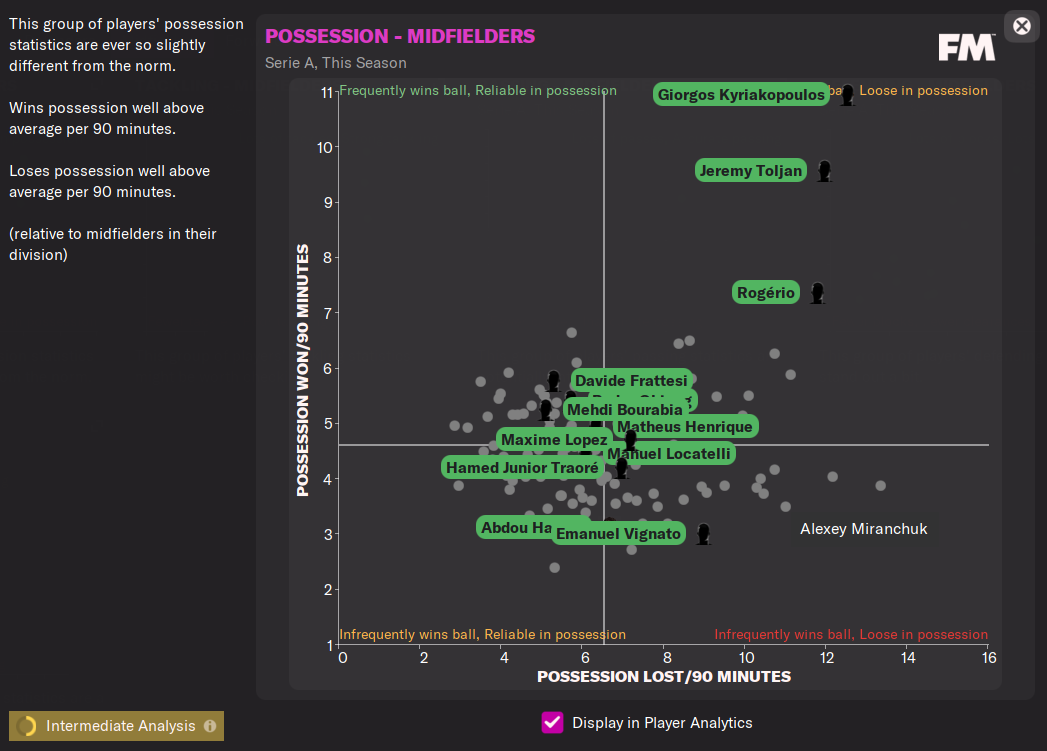
We see here that out of all first-team players in CM & AM positions (Vignato, Harroui are back up options with few matches played) Junior Traore (who only played the SS role so far) is the least efficient in winning the ball.
Okay, so the potential conclusions & and adjustments are:
Conclusion a) The way we occupy space in the opponent’s half just after losing the ball leaves gaps for the opponent to exploit and allows them to by-pass our high press.
Solution? Review player positioning in the early opponent counter phase and adjust player movement settings (roles & instructions) so that we have efficient space coverage high up the pitch
Conclusion b) The front three roles are not properly instructed to press.
Solution? Review player’s pressing and tackling instructions( e.g. tackle harder for front 3, potentially change DLF to PF)
2. Players efficiently moving the ball forward
Now onto the next phase of play: let’s say we have adjusted the set-up so that we are better at winning the ball higher up the pitch and involving attacking players more in that process. Ok, now that we have won the ball, what do we do with it? What I want is for my players to profit from the opposition being out of their defensive shape in the moment of winning the ball and quickly moving the ball forward to an attacking player to capitalize on their lack of defensive organization in those few seconds.
Looking at the passing stats on a team level our performance is a bit of a ‘jekyll and hyde’, to use some FM dialectics.
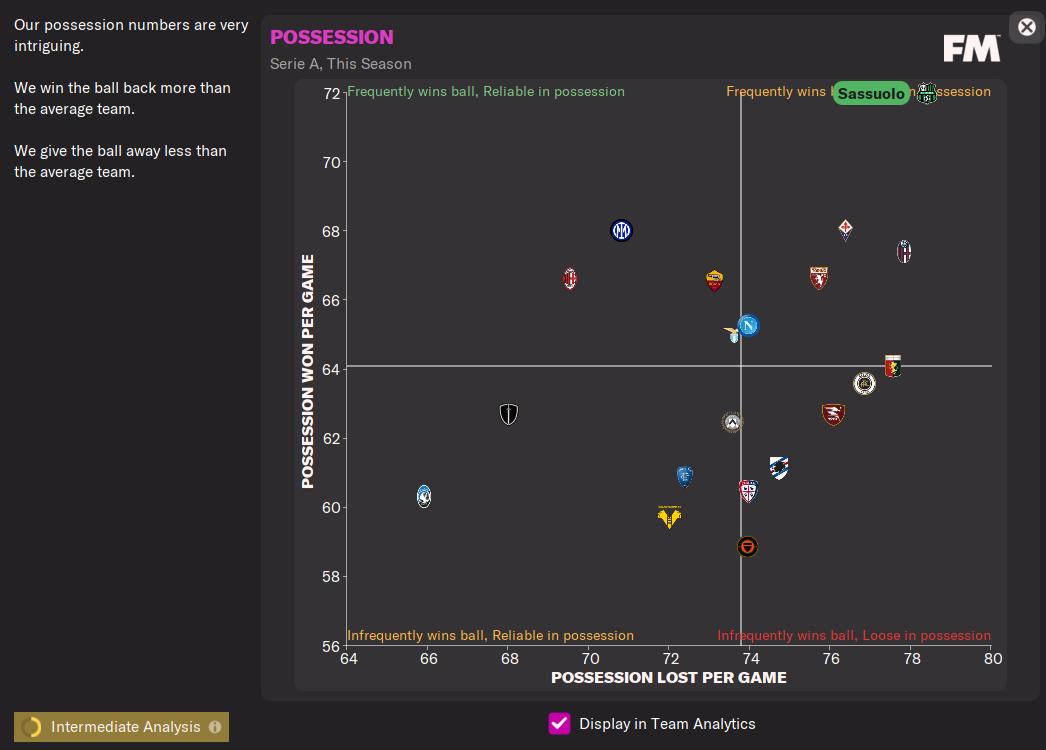
We win the ball more than any other team in the league and that by a far margin but at the same time we also lose the ball extremely frequently.
Let’s also check our passing volumes & efficiency in the midfield strata:
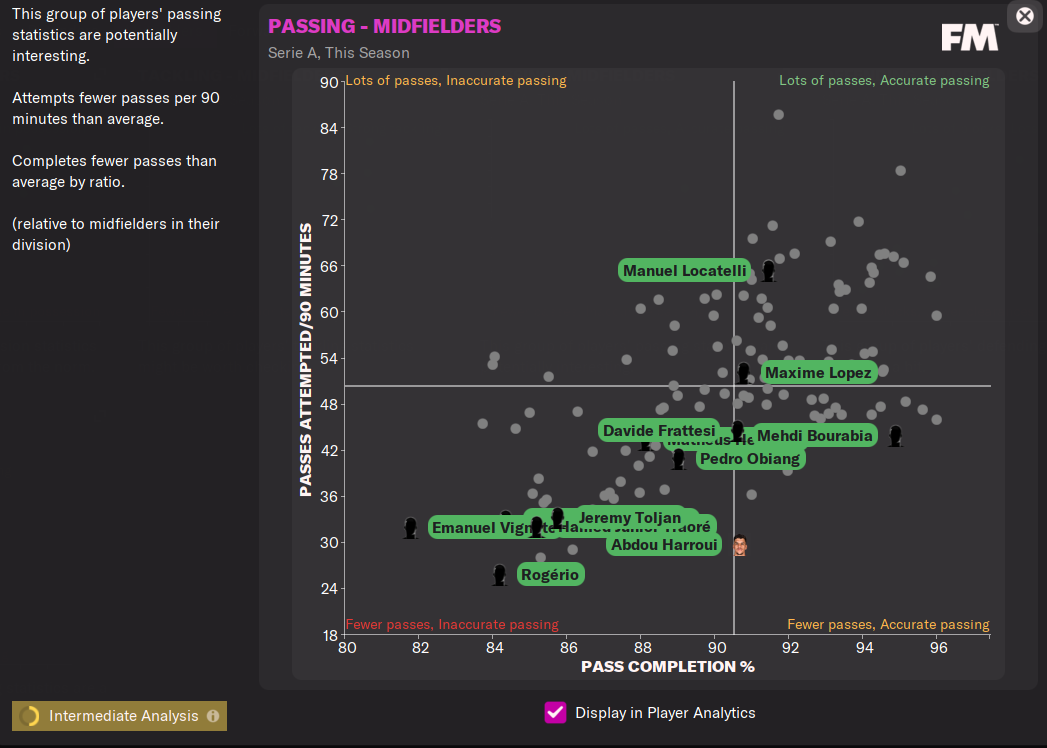
The low passing volume in this scenario is not a bad indicator – it actually is part of the plan because I want my players to attempt forward passes rather than holding on to the ball and passing sideways, which would naturally mean less passes.
Also, looking at the graph the first, instinctive reaction would be that we are extremely inaccurate in our passing, right?
Well, if I look at the actual percentage numbers, our main midfielders, Maxime Lopez, Frattesi and Matheus Henrique all average more than 88% pass completion ratio which is actually pretty great considering that most of their passes are vertical and not horizontal. That means, basically, that 1 in 10 medium to high risk passes fail, which I would much rather have than 98% pass ratio when all passes are low risk.
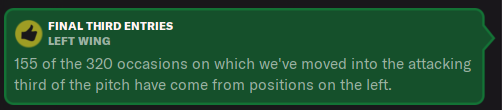
So passing-wise we are doing well given our style of play, however the design of the system implies the fact that a lot of final-third entries will be executed via the left wing-back attacking space high up the pitch in the pockets freed up by the central-drifting AM and providing crosses to the attacking players.
Checking the Last-5 match analysis in the Data-Hub, we can see that’s working well in terms of final third entries:
When we look at the crossing stats of our left wing-back, however:
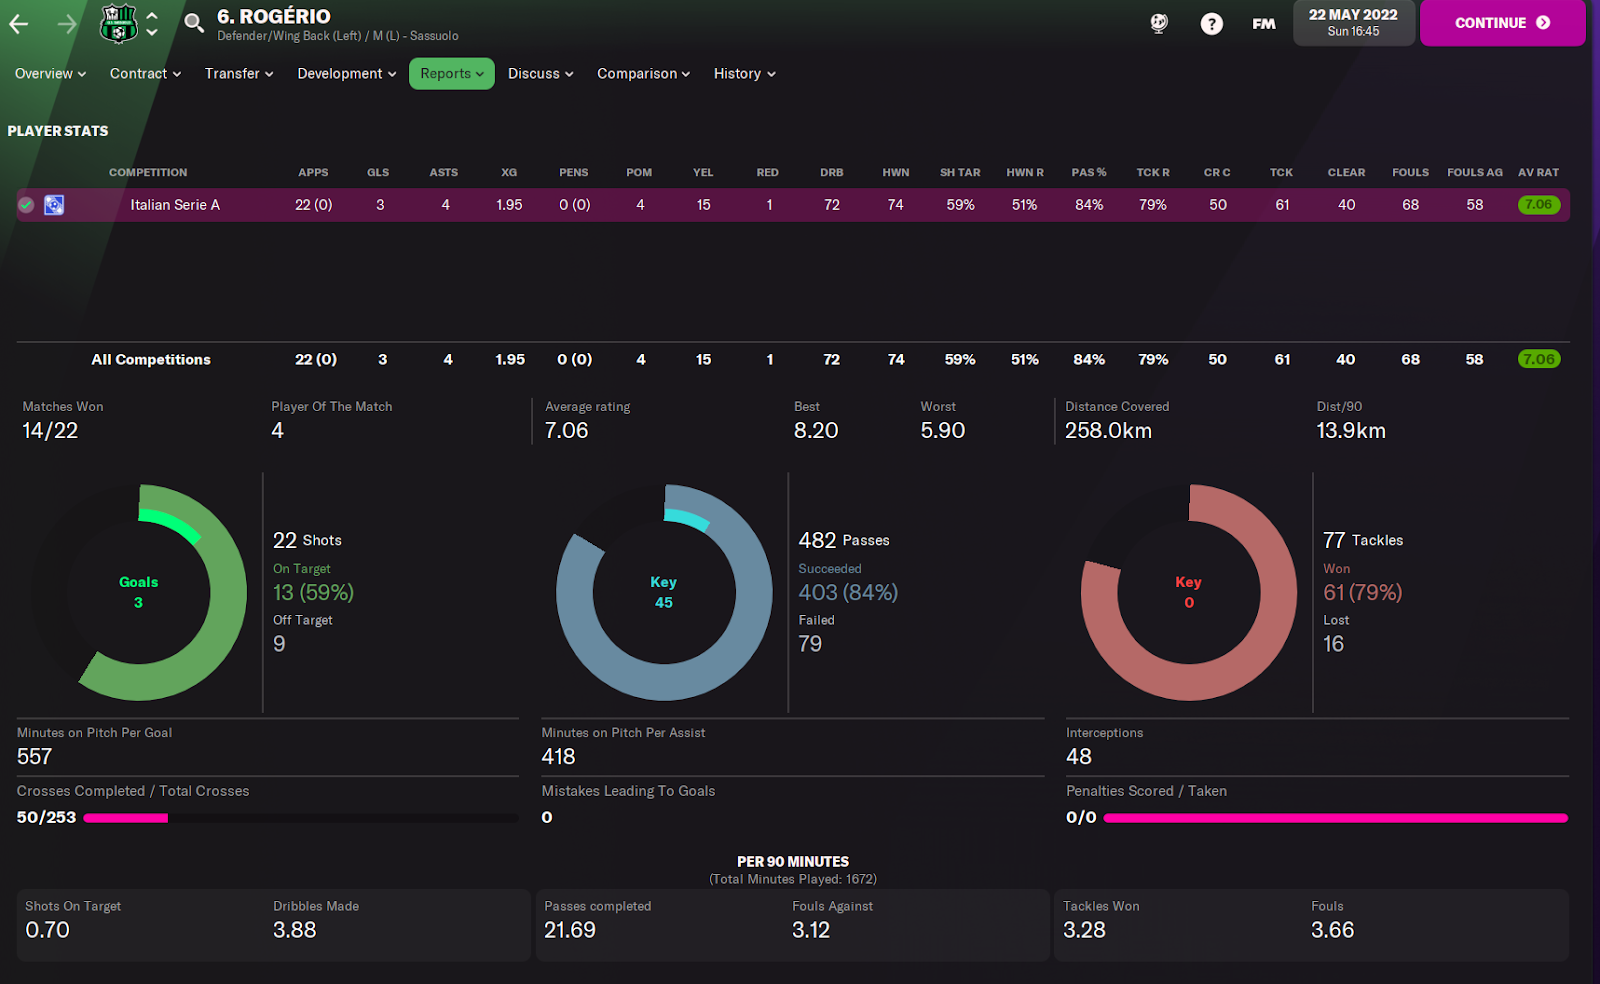
We can see he completed only 50 out of 253 crosses! That means fewer than 20% crosses our left wing-back put in were completed in a tactical style that relies so heavily on this position that around 50% of our total final third entries were performed by him.
The lack of cross completion in this case could be influenced by a few factors:
- Player dispatching crosses has poor stats for crossing
- Poor player positioning / lack of enough runners in the box to connect with crosses
- Players receiving crosses have low stats for either finishing, first touch if the crosses are low or are simply not tall enough to connect with floating crosses
Taking them one by one:
- Rogerio has 13 for the crossing attribute which is definitely not bad for a wing-back
- In a typical situation involving a cross from the left wing-back we have great player positioning in attack – our front three are in the box and the right-sided CM acts as a late box runner option
- Our DLF, AM and W have excellent stats for finishing & first touch:
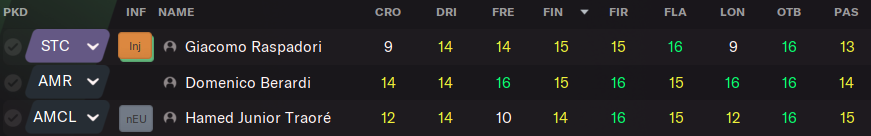
but shockingly low stats for heading, jumping reach and height. In fact, our main starters in these positions win an average of 2.4 headers per game and a 38% header win ratio average:
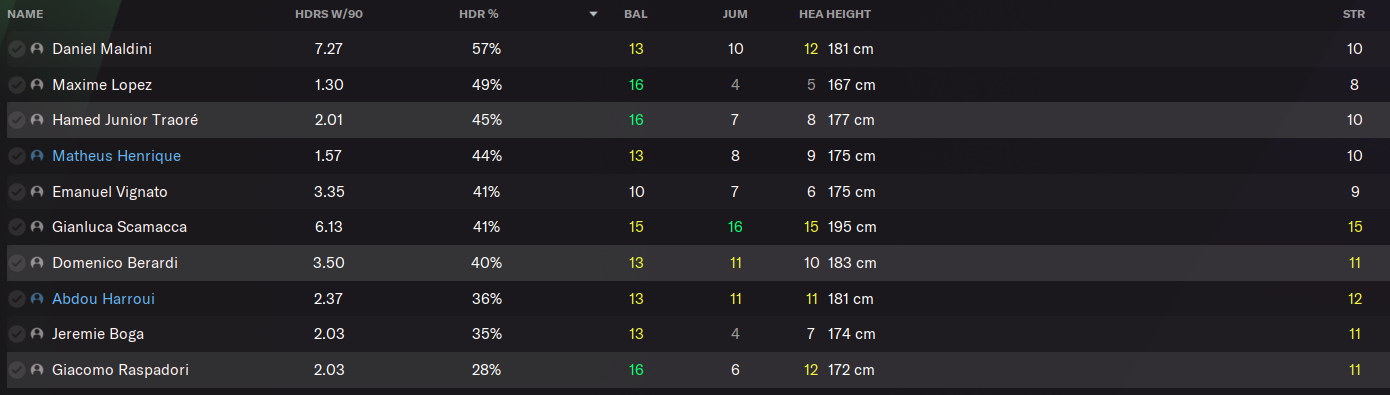
Okay, so the conclusion is fairly obvious: we are dispatching floating crosses to players that have virtually no ability to challenge for the ball in the air.
Solution? Ticked ‘low crosses’ in the team instructions for now. We can then further analyse how the cross completion percentages change and if there are no improvements then we might need to rethink the way we attack space on the left side of the pitch completely.
3. Players converting chances in the final third
Havin improved the way we first win the ball and then ensure its efficient progression to the players responsible for finishing, we now need to take a look at how efficient they are at converting these chances. In other words, it would be pretty pointless to have the previous two phases of play working efficiently without making it count where it matters the most: in front of goal.
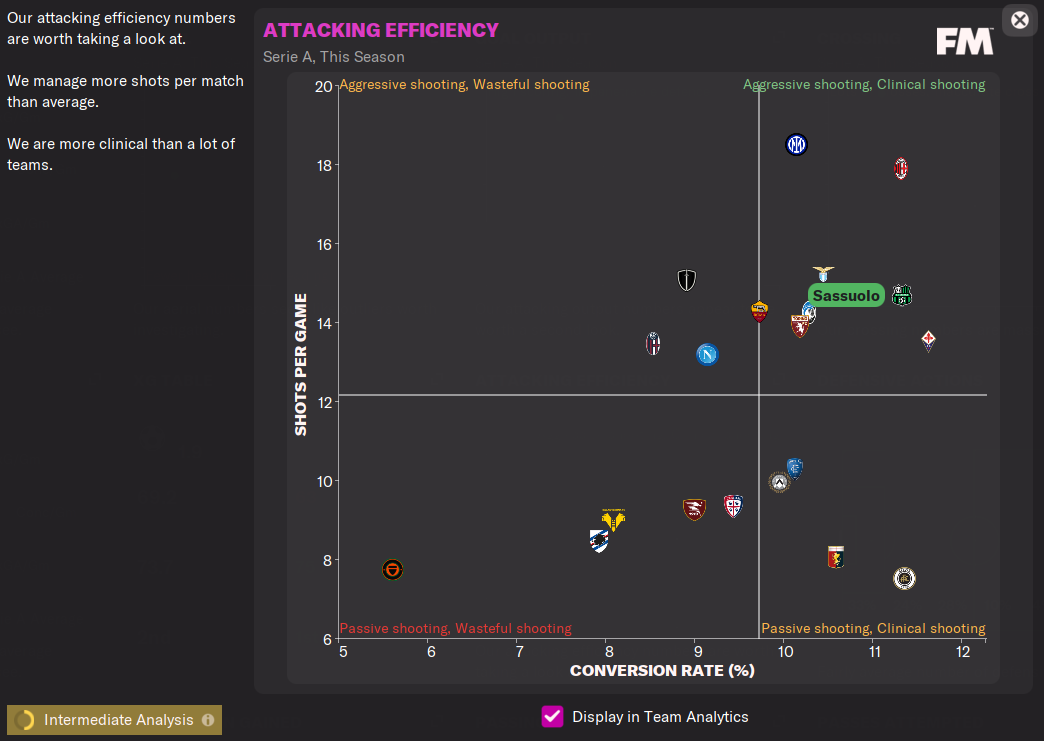
Overall, as a team, it looks like we have a great balance between the number of shots taken and the percentage of those shots that result in goals.
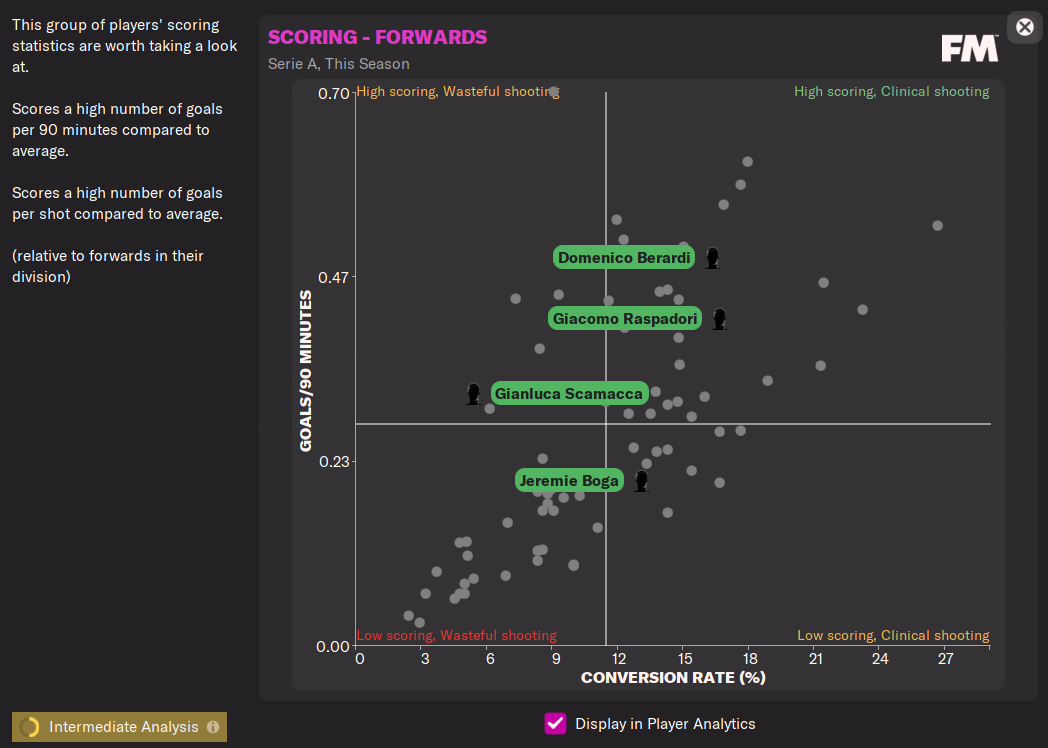
A closer look at the front three tells us the player that both, attempts and converts the most shots is our AMR:
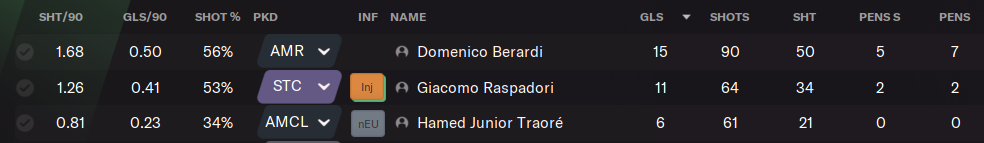
The outlier here is the SS (Traore): he takes as many shots as our DLF but his ratio in terms of goals per shot and shots on target is much worse.
Conclusion: Right now the front three combine for 1.14 goals/90 mins. If we can get Traore to improve shot conversion to 50% we would have 1.32 goals/90 mins. 0.18 goals per match X 38 matches means an extra 5 goals per season.
An alternative scenario would be to ‘transfer’ some of the shots Traore is attempting to either Berardi or Raspadori. Given his position just behind the striker we could benefit from him more if he would attempt to pass to the DLF or W rather than going for the shot in situations where shooting is difficult. Statistically, if we have an 18% shot-to-goal conversion rate for Berardi and Raspadori that means that if they were to attempt 30 more shots we would have an extra 5.4 goals per season from them:
Solution? We have a number of options here that could potentially achieve the same desired result:
- Restrict the number of shots Traore is taking via player instructions (shoot less often) and instruct the player to attempt more risky passes
- Train Traore to develop new PPM ‘looks for pass instead of shot’
- Train Traore to improve long shots, finishing and composure attributes
Now all these would be ‘individual’ solutions to the identified problem. A ‘collective’ solution in this scenario could be to try ‘working the ball into the box’ as a team instruction however that would have large implications on the behaviour of all attacking players by slowing down tempo around the opposition box.
Conclusion
Overall, the FM22 data hub and the general statistical data available in FM can help you dissect and optimize your tactics to great extent. What is important to remember, however, is that stats can be often misleading if not interpreted in context – a 84% pass success ratio is great if 80% of your passes are vertical and high-risk and the same figure is pretty terrible if most of your passes are side-ways and low-risk.
As a consequence, having a vision of what your ideal style of play looks like and working towards achieving it will help you better interpret and digest the huge amount of information available in the wonderfully comprehensive Data Hub.
Follow me @LPQR_FM for more FM22 analysis & tactics or find us on Twitter @DictateTheGame for more Football Manager news and content.
Check out these articles below for more on FM22:
- Your New Save: Day One on Football Manager 2022
- FM22: 5 Things to do Before Pressing ‘Continue’
- Don’t Let Your Dreams Be Memes
- Canadian Premier League in Football Manager
2 thoughts on “Improving your FM22 tactic using the Data Hub”
Cool, obvious, elementary. However the conclusions in the above example are partially wrong. The main problem in both pressing and fast forwarding the game to the final third of this team is poorly assigned roles. BWM leaves the zone during pressing, SS always look on DLF’s position, DLP holds the action, CWB is completely isolated playing with the ball. I would start from this and then see the stats.
It does not change the fact that the article is interesting, and the presented inference path is correct.
fm is not based on how you would like it to be played, but how and with what you can.. high pressing means that you will take the ball very high, and who will take the ball if your attacker has aggression, for example 11? or a winger? I think it is a lot engagement misunderstood.. high pressing is an attempt to take the ball