Data Analysis at half time: Win the Second Half!
You’re down 1-0 at half-time, the team is not performing well at all. In the past we had to rely on the eyeball test. Who looks like their struggling out there? Who’s getting beaten to the punch? Where were the gaps? Let’s look at the Data Analysis.
Luckily, technology has stepped in and we have a breadth of data available to us on the touchline (if you can afford an iPad). In FM22 we have a brand new Data Hub that we can use to analyse performance data over the season. What about during the match?
At the half-time screen there is a Analytical Data button that reveals all the data from the in-game Data Hub in the first half. You can break this down by team or by player and there are many areas to examine. Let’s dive in.
Shots
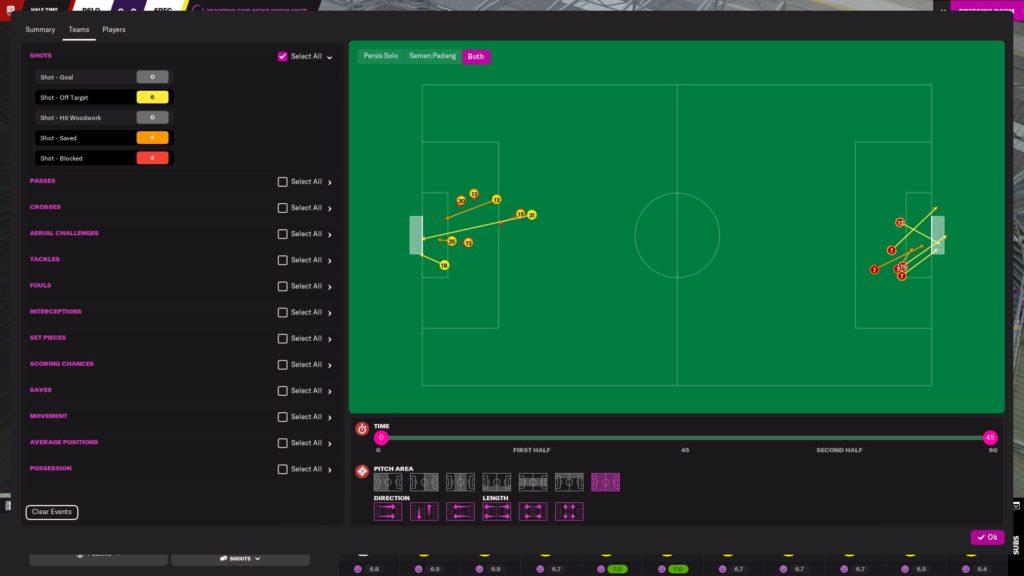
In the above screenshot, we’ve got all the categories of shots enabled. It was 0-0 at half-time in this game. And as you can see for my yellow team, it was a mixture of shots from outside the box and a couple high xG chances in the box. Maybe we need to work it into the box more in the second half. The red team looks to be getting greater quality chances here, especially from number 7. He got 4 shots in the first half in the box. We can maybe try to mark him out and isolate him in the second half.
Scoring Chances
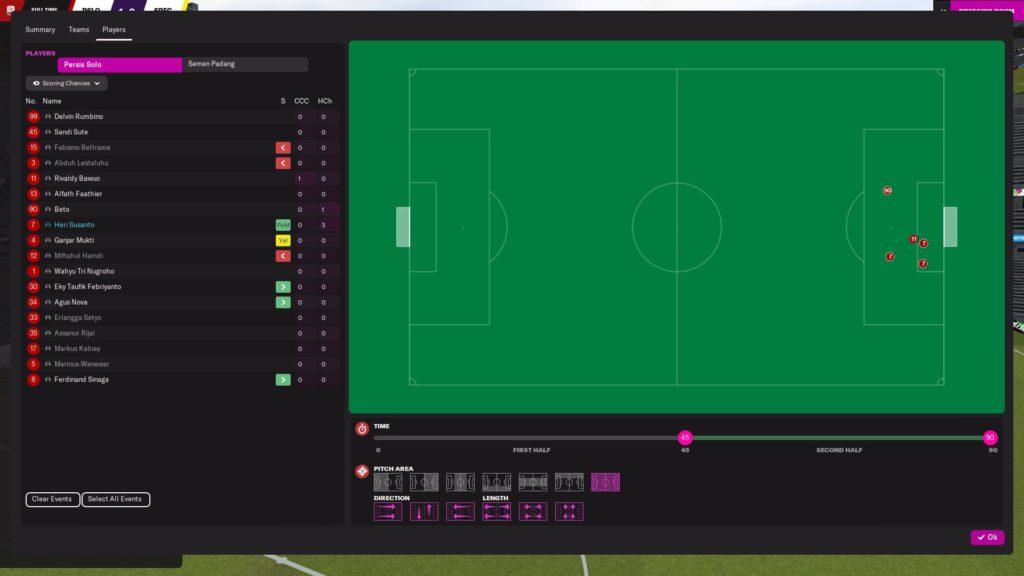
Looking at the opposition scoring chances here they are getting a lot of love inside our 6 yard box. I think we’ve got to push them back and cut off the supply line here so they can’t get these high quality chances. We can also flip this around to look at our own chances to see if we need to keep doing what we’re doing or make some improvements to get into better positions.
Passing
Passing stats data analysis can be overwhelming at first glance, but after turning off most things and identifying some key categories it can become a much clearer picture.
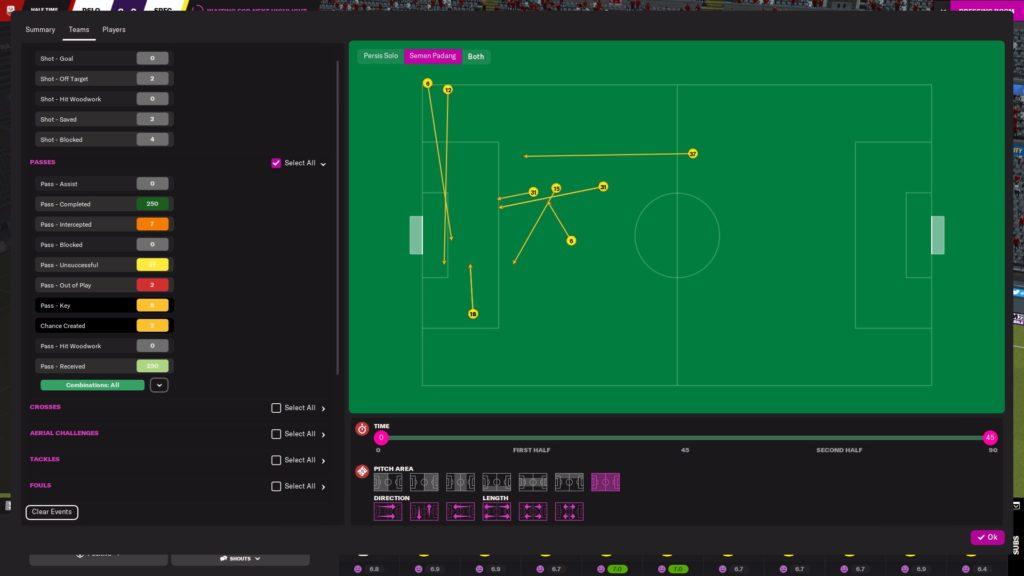
We’ve got ‘key passes’ and ‘chances created’ activated here after turning off most other categories so we remove the noise. You can quickly identify key contributors and what types of positions the team is being successful from. Passes through the middle to the striker, and the right winger is finding success getting crosses in from deep. You could reverse this for the opposition to see where their danger men are from a creative point of view, and try to isolate them and block their passing opportunities in the second half.
Defensive Stats
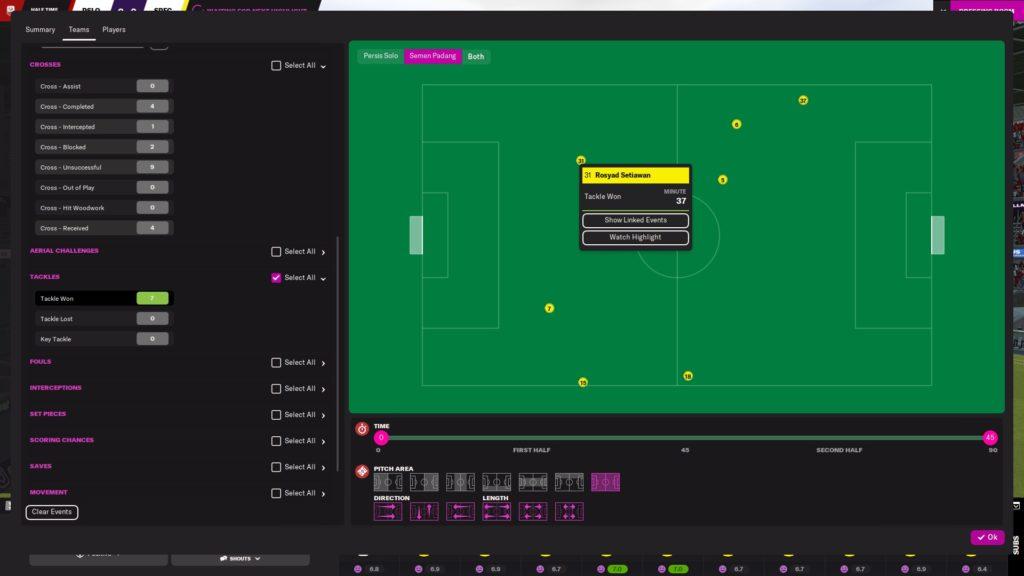
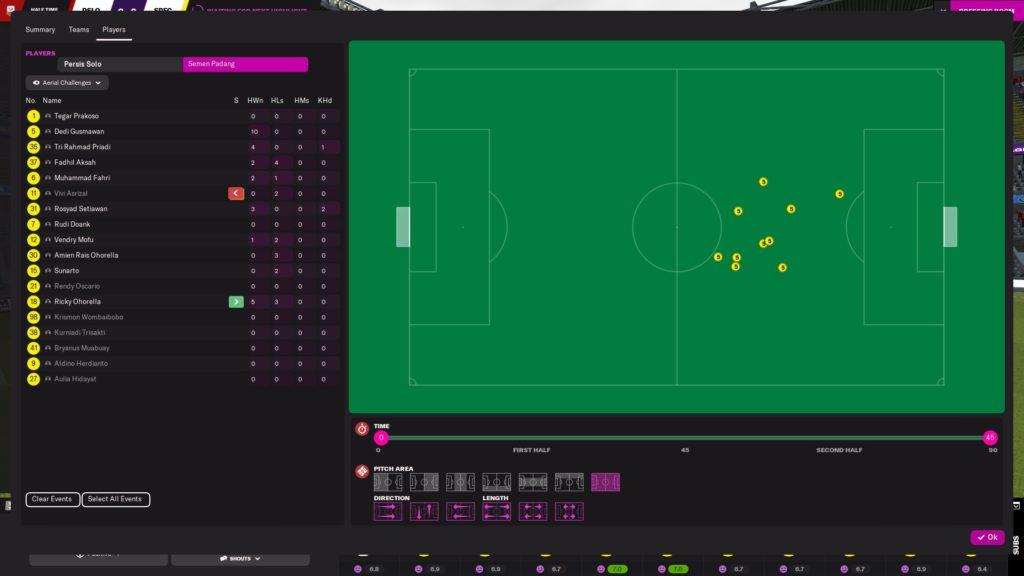
Two interesting defensive stats, both from a team view and an individual player view are Tackles and Aerial Challenges. You can see who is winning your defensive headers, if forwards are winning headers in dangerous areas. Midfielders who are winning lots of tackles, there are many options. You could also have a look at Tackles Lost to see who is struggling defensively there, the same with the stats in the air. And vice-versa, looking at the opposition’s defensive stats to see if you could exploit any weaknesses.
Average Positions & Possession
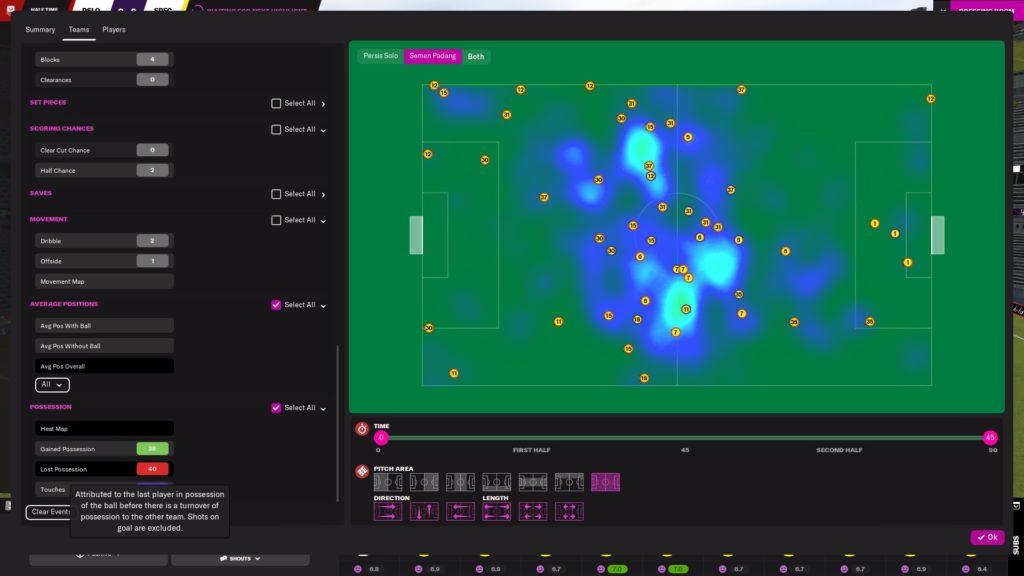
Average positions can sometimes be a head scratcher about how best to utilize this data, but I think you can use it from the perspective of seeing if your players are where you expect them to be or if they’re consistently out of position. Either by a man-marking duty or just poor positioning. You could also try to identify a tricky opposition player and try to pull him out to make room for someone to run into.
Possession stats are good for finding out where you are winning and losing the ball, or where the opposition is doing that. You can identify players who are losing the ball consistently and try to modify their role, or make a substitution. You can also try to put pressure on opposition players who are losing the ball more often in dangerous positions.
In Conclusion
There’s a lot to look at for data analysis in the data hub. Nor surprisingly, some players may be struggling to best utilize it in Football Manager 2022. The In-game data analytics are an interesting and often overlooked part of the match engine. Especially, if you are at a loss after a frustrating first half, it’s useful to have a look in here. So you could identify some key areas to try to improve. Obviously it will take some trial and error to see what works and what doesn’t for you, but I think there’s a lot to chew on in these screens and it’s great stats to have on hand during the match.
Follow DictateTheGame on Twitter to keep up with the latest from the DTG Team!
- One-Club Man: La Cantera
- One-Club Man: Defence-First Football & Club DNA In FM24
- One-Club Man: 1st Day on The Job, Meet The Team
- The Story of One-Club Man
- FM24 Release Date Announced!